Chart.js module for charting maps with legends. Adding new chart types: choropleth and bubbleMap.
works great with https://github.com/chartjs/chartjs-plugin-datalabels
Install
npm install chart.js chartjs-chart-geoUsage
see Examples
CodePens
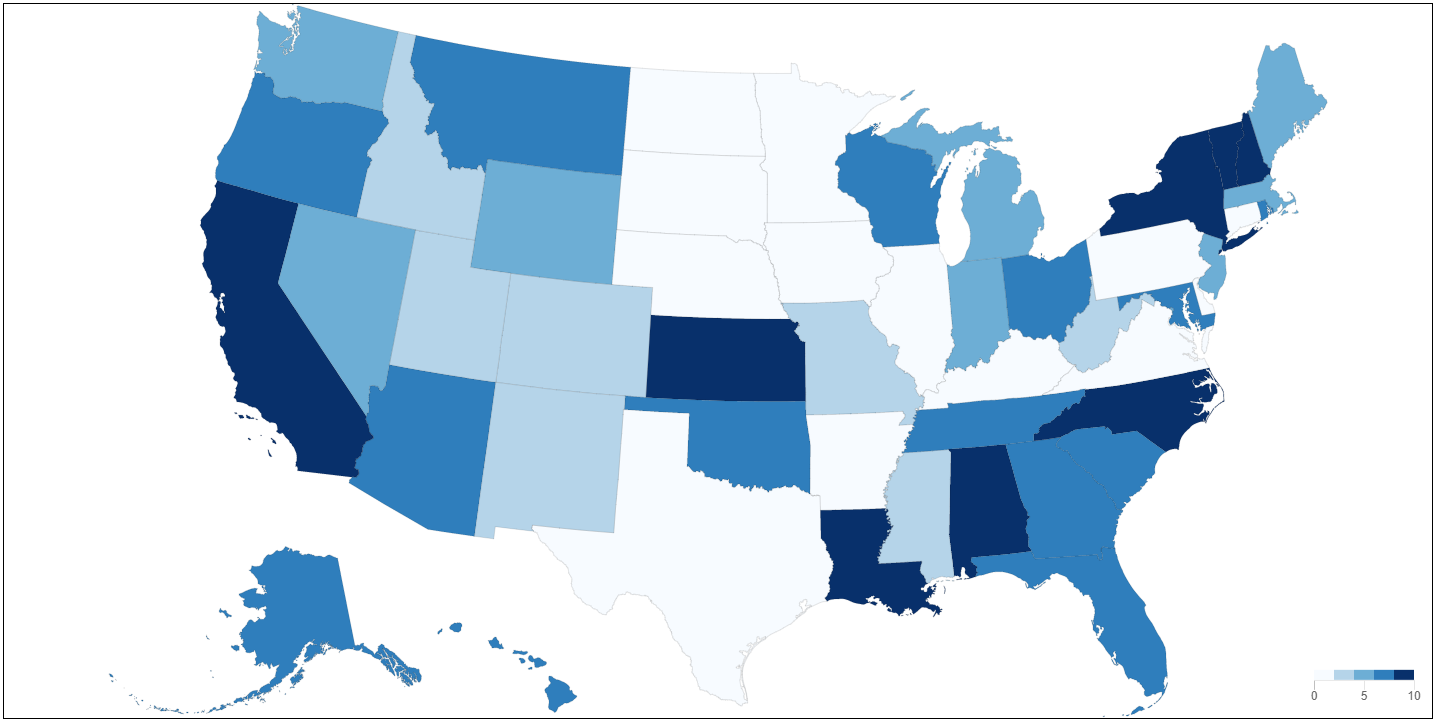
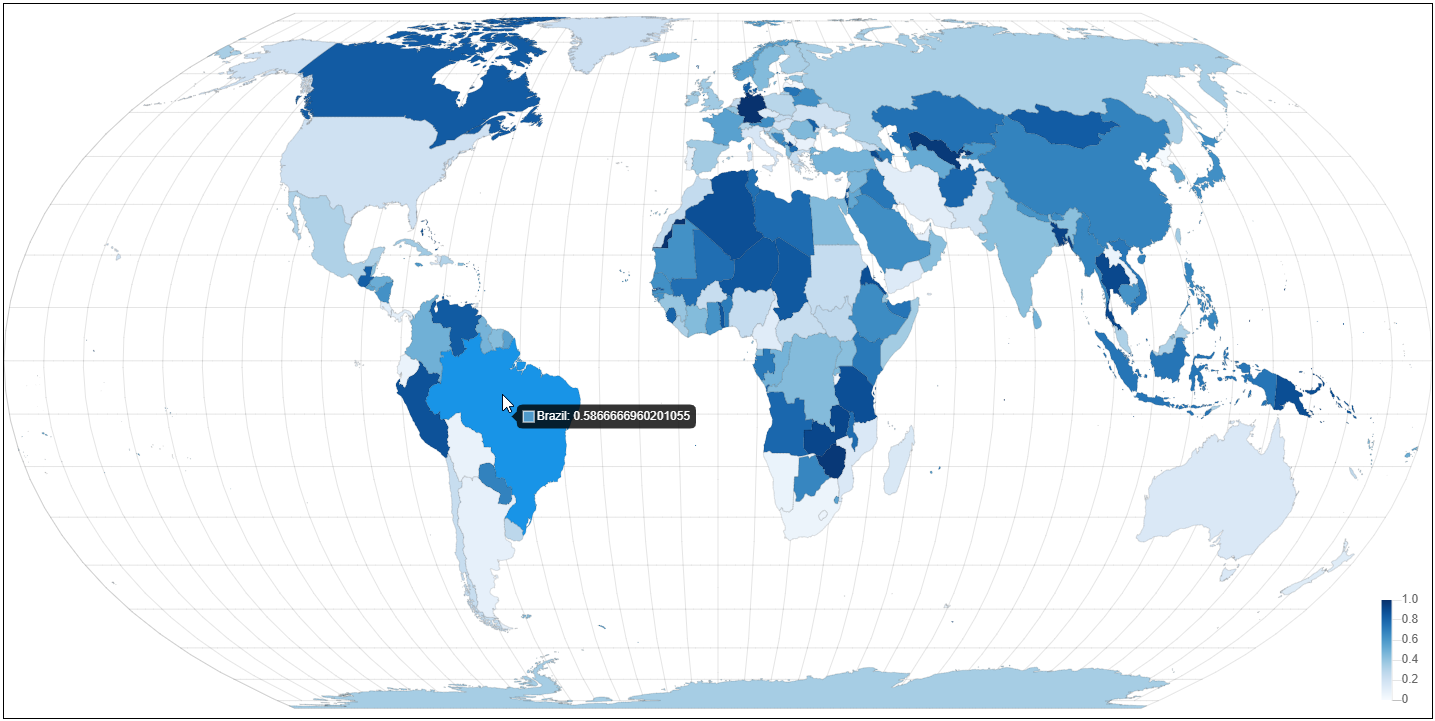
Choropleth
A choropleth map is a geo visualization where the area of a geometric feature encodes a value. For example Choropleth.
WARNING
This plugin is not providing the geometric data files (like GeoJson or TopoJson) but they need to manually imported and defined.
Each data point is an object with a feature and a corresponding value. see also IChoroplethDataPoint
Configuration
The controller has the following options IChoroplethControllerDatasetOptions. In addition, the projection of the geometric feature to the pixel space is defined in the projection scale. see IProjectionScaleOptions for available options. The conversion from a value to a color is performed by the color scale. see IColorScaleOptions for available options.
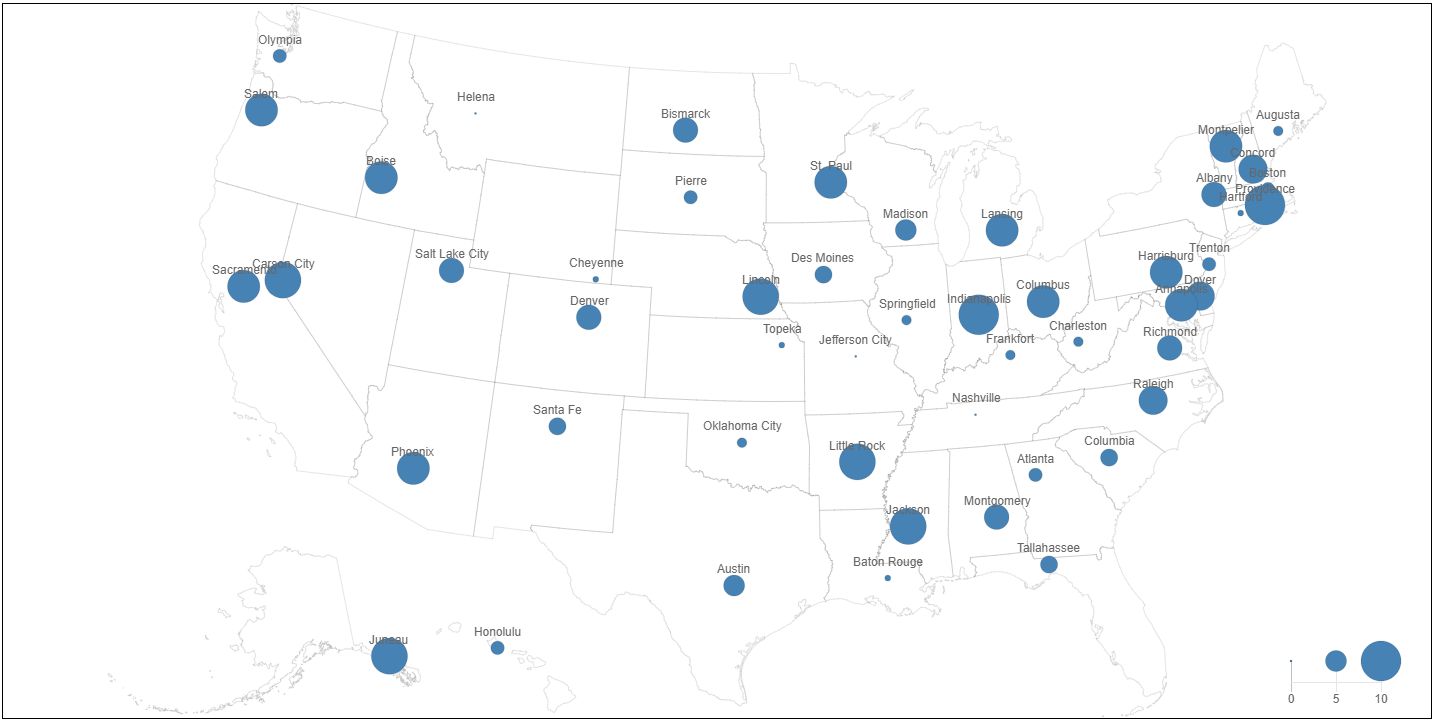
Bubble Map
A bubble is using the area / radius of a circle to encode a value at a specific latitude / longitude. For example BubbleMap. Therefore, a data point has to look like this IBubbleMapDataPoint.
Configuration
The controller has the following options IBubbleMapControllerDatasetOptions. In addition, the projection of the geometric feature to the pixel space is defined in the projection scale. see IProjectionScaleOptions for available options. The conversion from a value to a radius / area is performed by the size scale. see ISizeScaleOptions for available options.