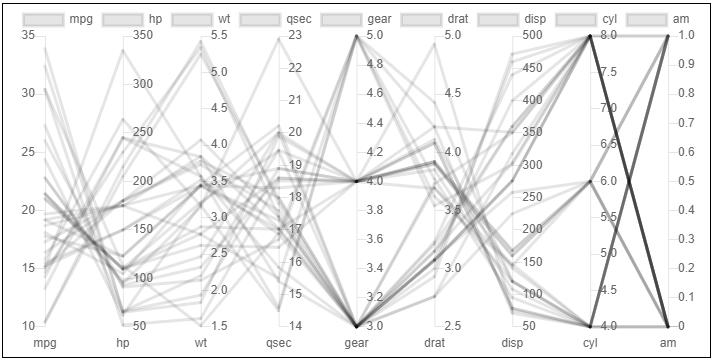
Chart.js module for charting parallel coordinate plots (PCPs). Adding new chart type: pcp.
Install
sh
npm install chart.js chartjs-chart-pcpUsage
see Examples
and CodePen
Configuration
Data Structure
the data items are the regular data items along with their labels. For each attribute there is a dataset. e.g., in the following example there are three items (A, B, C) with three axes / features (f1, f2, f3).
js
const objs = [
  { label: 'A', f1: 5, f2: 3, f4: 3 },
  { label: 'B', f1: 2, f2: 1, f4: 8 },
  { label: 'C', f1: 10, f2: 6, f4: 2 },
];
const attrs = ['f1', 'f2', 'f3'];
const config = {
  type: 'pcp',
  data: {
    labels: objs.map((obj) => obj.label),
    datasets: attrs.map((attr) => ({
      label: attr,
      data: objs.map((obj) => obj[attr]),
    })),
  },
  options: {},
};
Styling
Two new elements were added: lineSegment as a subclass of line for a line segment between two axes and linearAxis for representing the vertical axis as a wrapper around a linear scale.