Chart.js Plugins
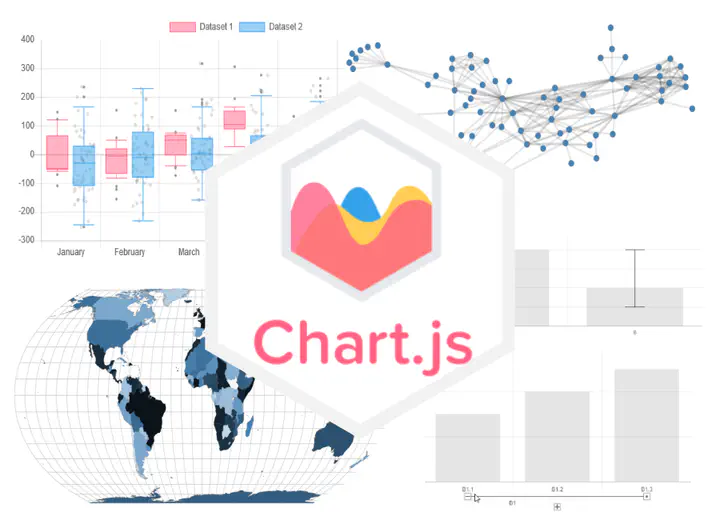
Chart.js is a JavaScript charting library based on HTML Canvas. It support various basic chart types but also allow developers to extend the framework using plugins. Over the last two years I created several plugins that improve the library and add new chart types as well as contributed to Chart.js itself:
The Box Plot plugin allows user to create box and violin plots. Box Plots allow to quickly summarize distributions by showing the most important statical values such as the median value and several quantiles. I also created a Hierarchical Scale Plugin that extends for example bar charts to group, collapse, expand, and focus on hierarchical data. It is an advanced version of the grouping feature in Microsoft Excel.
Recently I created several new plugins that further extend Chart.js to draw more visualization types. The Graphs plugin allows developers to show graphs/networks and trees, either using using a force directed layout or a fixed tree layout. The Error Bars plugin extend several standard plot types (bar chart, scatterplot, radial charts) to render error bars to show distribution and error ranges. The Geo Plugin allows developers to render choropleth and bubble maps, such as showing information on a world map about population densities. The PCP Plugin allows developers to create interactive parallel coordinate plots with optional bezier curves support. The Word Cloud Plugin allows developers to create word clouds based on d3-cloud. Then Venn Diagram Plugin allows developers to create Venn and Euler diagrams for two to five sets.
I’m happy that all my plugins are now listed on the official chart.js awesome list. Moreover, I started contributing to Chart.js itself by being the main initial contributor to its new TypeScript typings as well as their efforts for ESM Treeshaking support.
Samuel Gratzl
Toolsmith for explorers of the information landscape on their treasure hunt for valuable insights
Research Software Engineer with a focus on interactive data exploration