Samuel Gratzl
Toolsmith for explorers of the information landscape on their treasure hunt for valuable insights
Samuel Gratzl is a passionate Research Software Engineer with a focus on interactive data exploration. He is a full-stack developer with 10+ years of experience. In 2017, he finished his PhD in Computer Science with a focus on Information Visualization at the Johannes Kepler University, Linz, Austria. He loves to dig into code, hunt bugs, and design new platforms. His goal is to enable researchers to discover more insights easier and faster, as well as develop libraries that help other developers do the same.
Skills
D3, Vega, Plot.ly, ggplot2, matplotlib, Tableau, PowerBI
Jupyter, RMarkdown, Quarto, Dash, RShiny, tidyverse, pandas, numpy
PostgresSQL, SQLServer, MongoDB, Redis, ElasticSearch, Neo4j, SQL
JavaScript/Typescript, React, Svelte, Vue
R, Python, FastAPI, REST, Swagger, OpenAPI, GraphQL
GitHub, Git, Kubernetes, GitHub Action, Google Cloud, AWS
Experience
- Being part of the research team analyzing healthcare data and providing feedback on current product developments.
- Curated datasets based on the internal Truveta Platform.
- Developed processes and templates for effective healthcare studies, speeding up our study creation
- Created dashboards for Vaccine Effectiveness and Adverse Events of COVID-19 Vaccines
- Identified data quality issues and supported clinical informatics in tracking them down.
- Initiated and specified product features for advanced researcher experience.
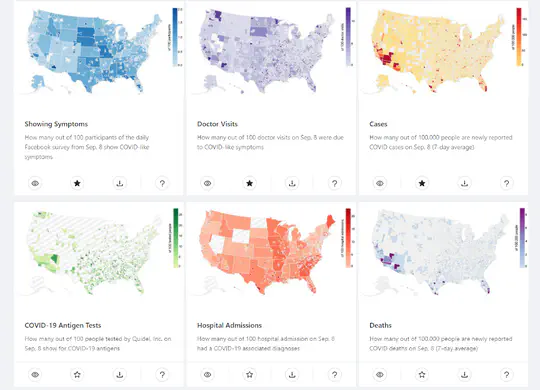
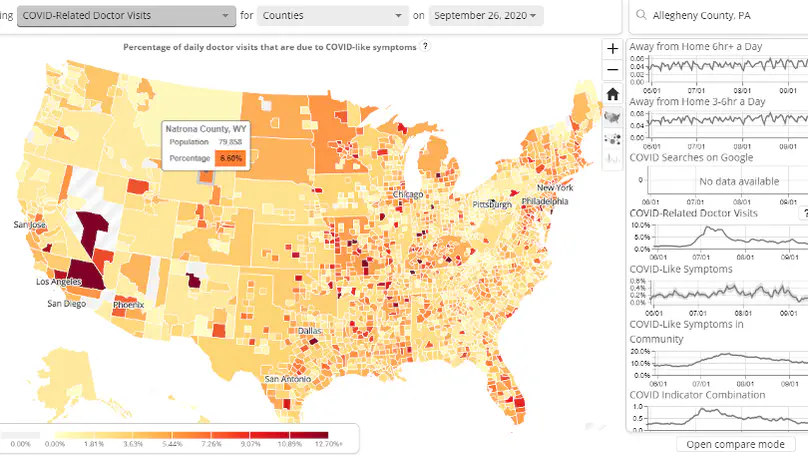
- Main front end developer of COVIDcast, a project by the Delphi Group collecting, publishing, and visualizing COVID-19 data..
- Converted the front end from a research prototype to a production-ready product.
- Enforced code quality and best practices throughout the project.
- Improved usability, maintainability, and performance of COVIDcast.
- Designed and implemented new views such as the National Survey Results View, the most popular COVIDcast view.
- Designed and implemented a new version of the COVIDcast API with increased maintainability, scalability, and robustness.
- Developed and deployed a new deployment infrastructure for the Delphi group.
- I specialize in the design and implementation of customized visual exploration web applications.
- In close collaboration with the customer, I develop specialized visual exploration platforms that not only allow the customer to answer their questions but even those they haven’t thought about yet.}
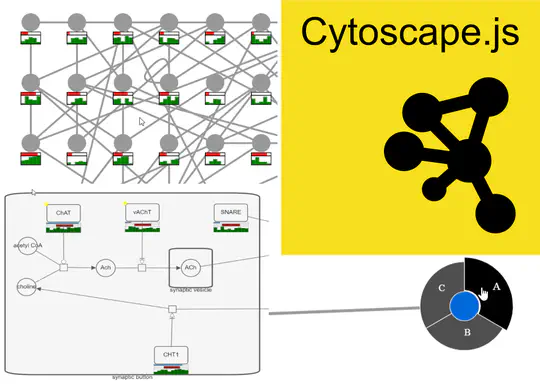
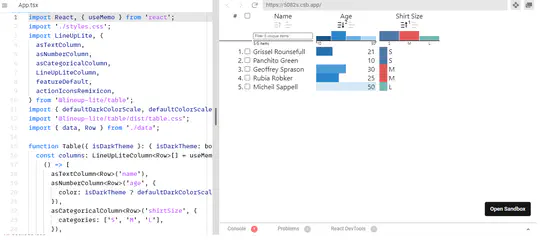
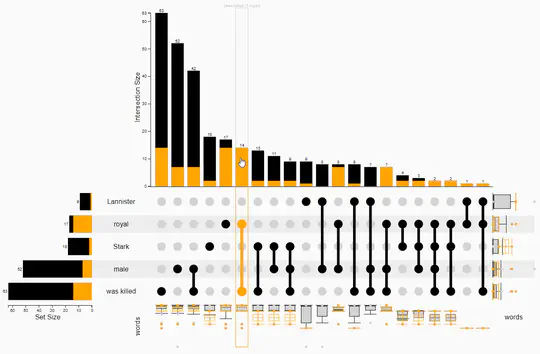
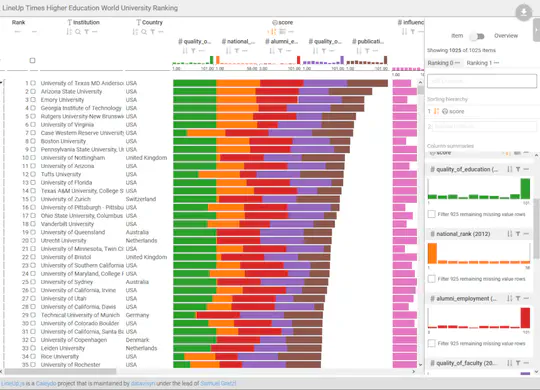
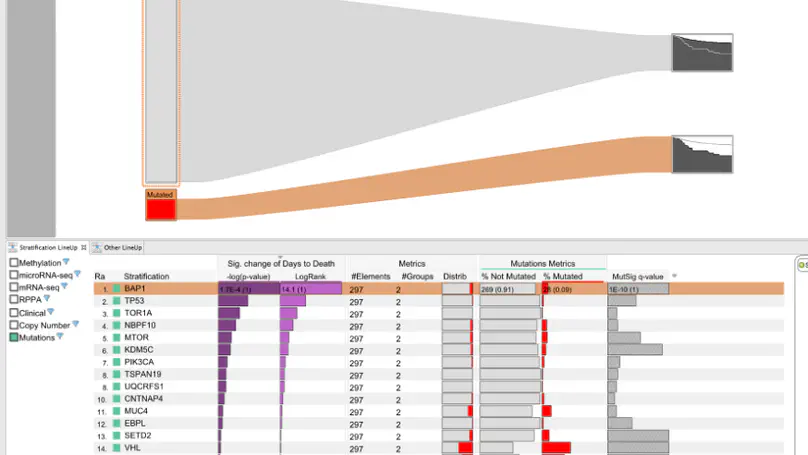
- In addition, I provide freelance service for integrating my open-source libraries, such as LinUp-lite, LineUp.js, or UpSet.js
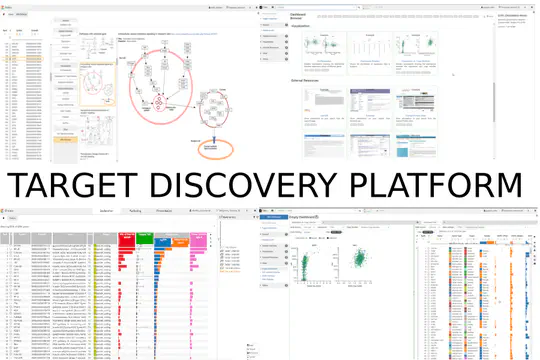
- Designed the architecture and implemented the Target Discovery Platform (TDP) with a focus on high extensibility and customizability. TDP is the foundation of all products of datavisyn and one of the three pillars of its business model.
- Built and deployed overall CI/CD infrastructure both in-house and on-premise focusing on high-availability, fault tolerance, and low maintenance.
- Lead on-site customer workshops focusing on requirements engineering, customer training, and initial prototype implementation.
- Improved project requirements to the satisfaction of the customer.
- Was the product owner for two agile customer projects which ended both in time and budget with highest customer satisfaction.
- Implemented critical features in all (4+) customer projects of datavisyn.
- Made customers happy through continuous customer support via Slack and quick response times.
- Lead, trained, and mentored the three junior developers.
- Did code reviews, introduced style guidelines, and introduced continuous testing to improve overall code quality.
- Ensured the head start of the company over competitors through integrating new technologies and frameworks.
Accomplishments
Projects

Featured Publications
Recent Publications
Contact
- contact@sgratzl.com
- Marlton, NJ 08053