Taggle: Combining Overview and Details in Tabular Data Visualizations
Abstract
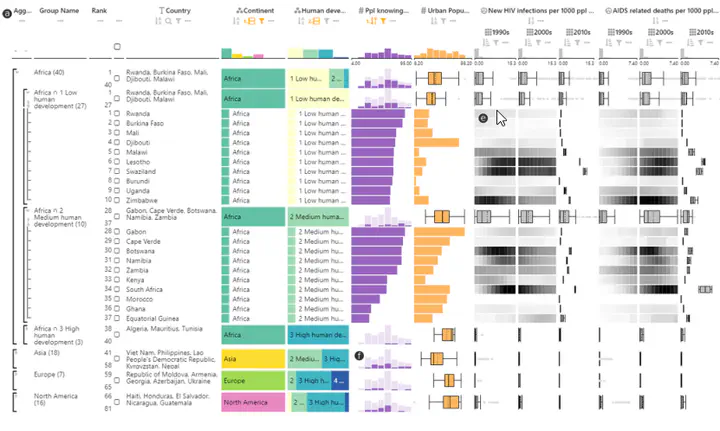
Most tabular data visualization techniques focus on overviews, yet many practical analysis tasks are concerned with investigating individual items of interest. At the same time, relating an item to the rest of a potentially large table is important. In this work we present Taggle, a tabular visualization technique for exploring and presenting large and complex tables. Taggle takes an item-centric, spreadsheet-like approach, visualizing each row in the source data individually using visual encodings for the cells. At the same time, Taggle introduces data-driven aggregation of data subsets. The aggregation strategy is complemented by interaction methods tailored to answer specific analysis questions, such as sorting based on multiple columns and rich data selection and filtering capabilities. We demonstrate Taggle using a case study conducted by a domain expert on complex genomics data analysis for the purpose of drug discovery.
Citation
Katarina Furmanova, Samuel Gratzl, Holger Stitz, Thomas Zichner, Miroslava Jaresova, Martin Ennemoser, Alexander Lex, and Marc Streit
Taggle: Combining Overview and Details in Tabular Data Visualizations
Information Visualization, 19(2): 114-136, doi:10.1177/1473871619878085, 2019.
Acknowledgements
We thank Bikram Kawan and Martin Ennemoser for their contributions to the initial prototype implementation as well as Christian Haslinger and Andreas Wernitznig for providing valuable conceptual feedback. This work was supported in part by Boehringer Ingelheim Regional Center Vienna; the State of Upper Austria (FFG #851460); the Austrian Science Fund (FWF P27975-NBL); and the National Science Foundation (NSF IIS 1751238).
Samuel Gratzl
Toolsmith for explorers of the information landscape on their treasure hunt for valuable insights
Research Software Engineer with a focus on interactive data exploration