ThermalPlot: Visualizing Multi-Attribute Time-Series Data Using a Thermal Metaphor
Abstract
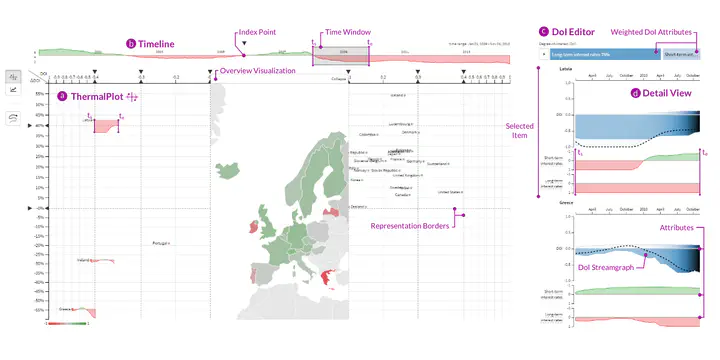
Multi-attribute time-series data plays a vital role in many different domains, such as economics, sensor networks, and biology. An important task when making sense of such data is to provide users with an overview to identify items that show an interesting development over time, including both absolute and relative changes in multiple attributes simultaneously. However, this is not well supported by existing visualization techniques. To address this issue, we present ThermalPlot, a visualization technique that summarizes combinations of multiple attributes over time using an item’s position, the most salient visual variable. More precisely, the x-position in the ThermalPlot is based on a user-defined degree-of-interest (DoI) function that combines multiple attributes over time. The y-position is determined by the relative change in the DoI value (∆DoI) within a user-specified time window. Animating this mapping via a moving time window gives rise to circular movements of items over time—as in thermal systems. To help the user to identify important items that match user-defined temporal patterns and to increase the technique’s scalability, we adapt the level of detail of the items’ representation based on the DoI value. Furthermore, we present an interactive exploration environment for multi-attribute time-series data that ties together a carefully chosen set of visualizations, designed to support analysts in interacting with the ThermalPlot technique. We demonstrate the effectiveness of our technique by means of two usage scenarios that address the visual analysis of economic development data and of stock market data.
Citation
Holger Stitz, Samuel Gratzl, Wolfgang Aigner, and Marc Streit
ThermalPlot: Visualizing Multi-Attribute Time-Series Data Using a Thermal Metaphor
IEEE Transactions on Visualization and Computer Graphics, 22(12): 2594-2607, doi:10.1109/TVCG.2015.2513389, 2016.
Acknowledgements
This work was supported by the ICT of the Future program of the Austrian Ministry for Transport, Innovation and Technol- ogy (BMVIT) via the projects PIPES-VS-DAMES (840232) and VALiD (845598) as well as the Austrian Science Fund (FWF) via the projects KAVA-Time (P25489) and VisOnFire (P27975-NBL). The authors also thank Bernhard Elias for providing valuable input concerning the stock market use case.
Samuel Gratzl
Toolsmith for explorers of the information landscape on their treasure hunt for valuable insights
Research Software Engineer with a focus on interactive data exploration